About
Collocates indicate proximate words that appear together frequently. The most common collocations are phrases used together so often that native English readers or speakers just automatically fill in the blanks, such as when native English speakers think of the word “aches,” they think of the word “pains.” Many large corpora represent generalized use of language; therefore, the collocates in those collections reflect common usage of speakers and writers. Sometimes these corpora are used in teaching English Language Learners or English as a Foreign Language Learners collocation phrases broadly used in English conversation.
However, specialized corpora focus on a particular place, situation, or time (Mackiewicz & Thompson, 2016; Partington et al., 2013; Potts et al., 2015); therefore, these corpora contain language specific to that place, situation, or time. As Jo Mackiewicz and Isabelle Thompson (2016) pointed out, writing center corpora are specialized, tend to be smaller, and contain specific contextual language. It is this specificity and contextuality that make writing center session notes a rich data source for examining collocates.
Writing center administrators examine session notes individually as a way to monitor consultant performance and to learn more about the work that goes on in a session, but micro views have limits. Analyzing the aggregate data available in session notes, devoid of individualized specificity, opens up possibilities for understanding writing center practices at a more macro level. Even more importantly, combining data from multiple writing centers into a corpus can help researchers understand collective writing center practices.
Data visualization tools such as Voyant are designed to filter and drill down into the data faster and more accurately than any human could do. In addition, the visualization tools in Voyant display the data in a way that encourages exploration and enables analysis. As George D. Gopen and Judith A. Swan (1990) asserted, readers do not just read, they interpret, and their interpretations are primarily influenced by the way information is structured. Voyant can take data that are opaque or convoluted in their natural, unaltered states and display them in a structure that facilitates analysis. In addition, controlling the location of the data and isolating parts of the data can unearth and reveal patterns that lead to better understanding and interpretation.
Choosing between corpus-based and corpus-driven analysis will determine how data are examined. Corpus-based analyses are conducted on pre-existing terms or phrases using hypothetical reasoning. In contrast, corpus-driven analyses explore data inductively; the visual display of data provides researchers with the ability to conduct corpus-driven analysis and discovery (Mackiewicz & Thompson, 2016). In the discovery process inherent to corpus-driven studies, text-mining tools actually create a new text, because the text exists in dynamic conversation with authors and readers. Geoffrey Rockwell (2003) asserted that “we should rethink our tools on a principle of research as disciplined play” (p. 213). It is this inductive, “disciplined play” approach that we took in demonstrating the tools in Voyant to explore collocates and interact with the text.
Examples
We used Rockwell’s (2003) notion to explore the interplay between the Terms Tool, the Collocates Graph, and the Context Tool in Voyant. We interacted with the structure of data organization and location using inductive reasoning to explore collocates in a corpus of writing center session notes.
We uploaded a file generated from the combined institutional documents comprising 1,997,453 total words and 23,649 unique words. The results are displayed in Figure 12.
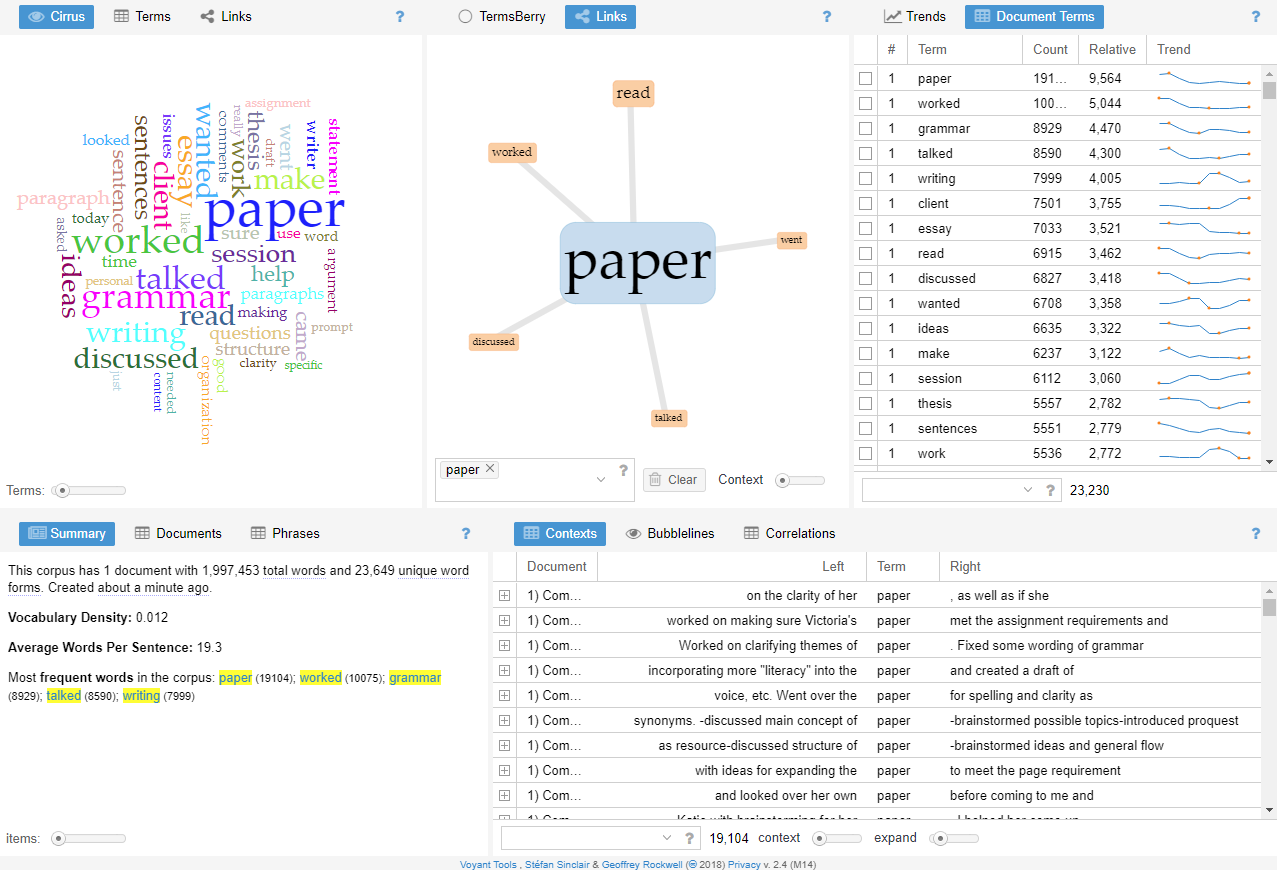
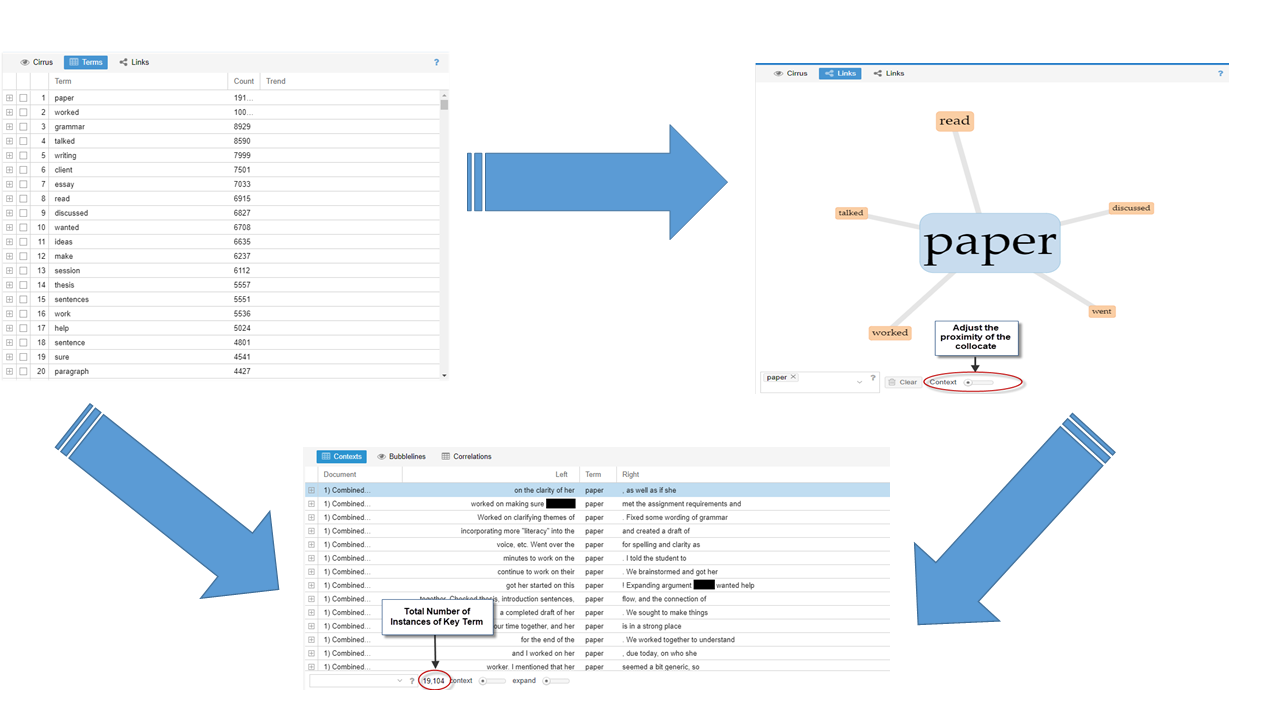
Voyant has a “choose your own adventure” structure on the home screen. The same data are controlled, organized, and displayed in different ways. In a corpus-driven analysis, then, this non-linear menu of possibilities facilitates inductive reasoning and exploration (Figure 13).
Because we were interested in exploring collocates, we replaced the tools on the home screen to provide only those tools that would allow discovery of collocates in the corpus. We started from the Terms Tool, as suggested by Amanda Potts, Monika Bednarek, and Helen Caple (2015). The Terms Tool revealed “paper” as the most frequently used term in the corpus (19,104 occurrences). However, just because “paper” is the top term does not necessarily mean exploring that term and its collocates will drive discovery in a corpus analysis. In fact, the term “paper” might just be a specialized stop word (common words in a language, either generally or in a specific context). Words that yield analytic possibilities are called “pointers,” and pointers and their collocates potentially yield insight into a research question (Potts et al., 2015). Voyant mines the most frequently used terms; however, screening the terms list for pointers is a manual process.
Once a term is chosen for analysis, the Link Tool/Collocates Graph displays the most frequently occurring collocates (Figure 14).
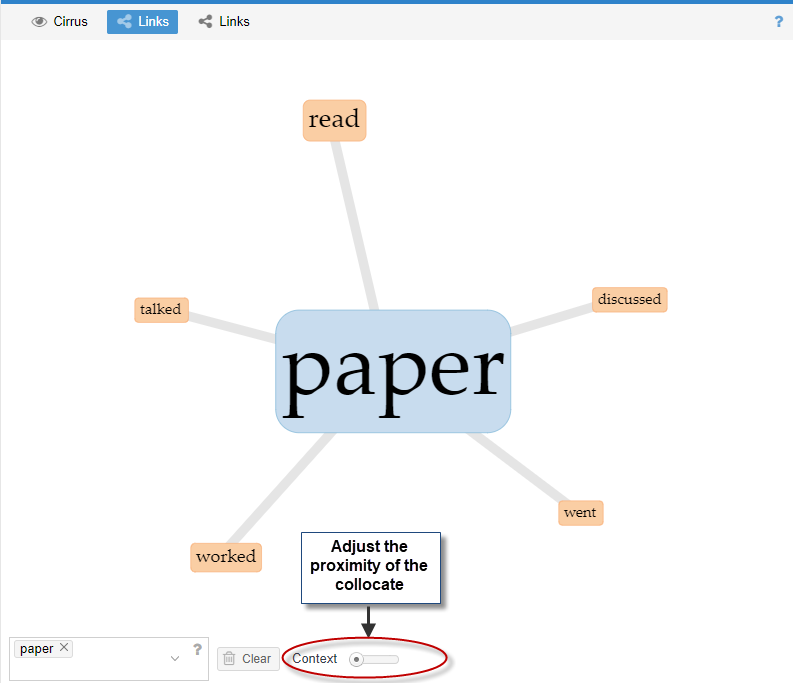
The collocate proximity can be adjusted as desired, but the lowest scale on the tool displays collocates next to the key term, minus the stop words.
Hovering over the collocated terms in the Links Tool/Collocates Graph yields the number of instances of collocation in the text. For example, the term “discussed” was collocated with the key term “paper” 550 times, as shown by hovering over the word link. One possibility for further exploration and analysis here could be to analyze trends or correlate for significance.
Another possible research move to make in a corpus-driven analysis could be to examine the contextual proximity of the collocates and what those might mean at the sentence level. The Context Tool in Voyant can be used to drill down to see the context in which the terms are used, as shown in Figures 15 and 16.
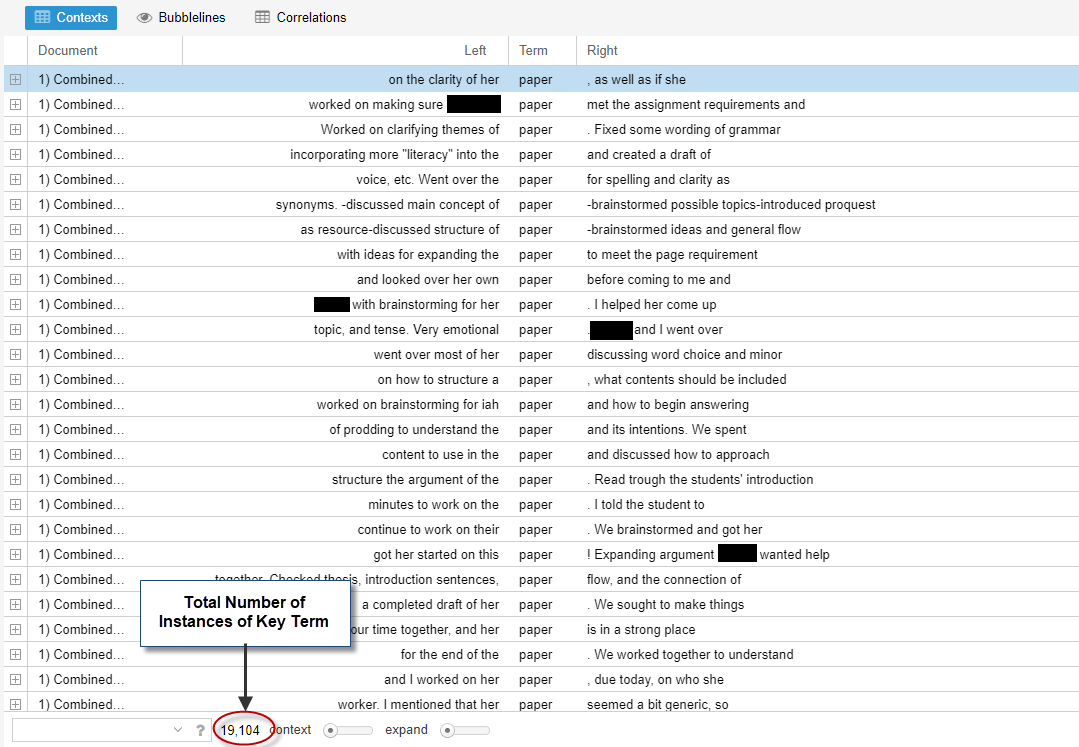
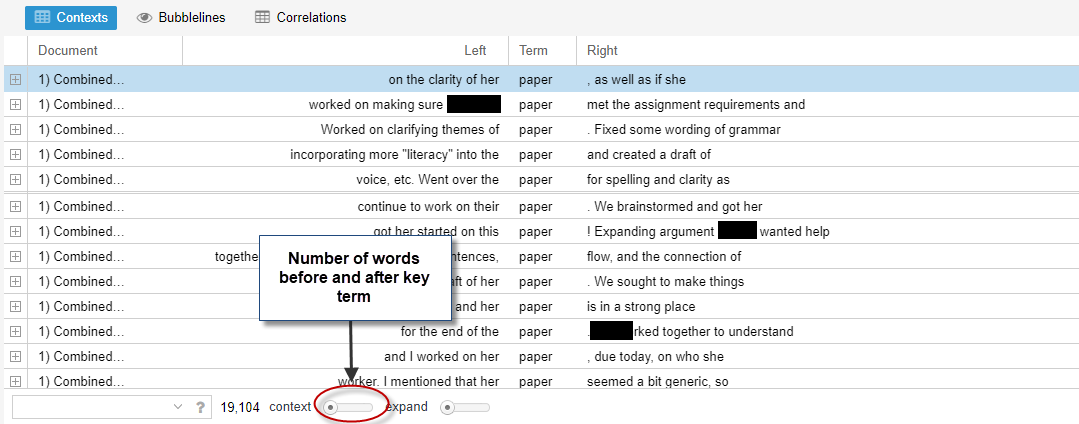
In Voyant, the Context Tool allows adjustment to the word span on either side of the key term as shown in Figure 16. Four- and five-word spans are common, although Potts et al. (2015) emphasized that different collocation spans will yield different analytical results. Adjusting the spans might yield more analytical possibilities.
Implications
The Collocates Graph and other Voyant tools both aggregate and organize unwieldy data so “disciplined play” can be used in corpus-driven analysis. We could read all 1,997,453 words from our combined corpus, and we could analyze each session note individually using qualitative methods such as discourse analysis. However, trying to manually analyze the data as presented in the text’s raw sequential structure is too labor intensive. As Gopen and Swan (1990) asserted, interpretation depends on structure, and in this corpus, the individual session notes are unintelligible at a macro view. Therefore, visualization tools such as Voyant can efficiently organize and present data in interpretable structures. Digital humanities scholar Ted Underwood (2011) suggested using computer-based analysis tools to bring patterns to the surface and then employing close reading to interpret the data. Writing center session notes presented in data visualization structures facilitate analysis and can act as jumping off points for other types of analysis such as discourse analysis. More importantly, re-visioning how we look at writing center data through visualization tools can help unearth our practices and provide the means to make those practices more transparent.