Study 1 Question 3:
How consistent is the average rating for each sex?
As mentioned in Question 2, averaging can be problematic
because it does not show the variance of the answers. This question examines
the variance of participants' ratings
to determine how appropriate the averages are for representing the rating,
and explores how or if the two sexes varied in their ratings of gendered
statements.
Studying the results of each of the 48 statements
would be time consuming and the results may become repetitive. So, I examined
this question by first choosing a subset of statements to analyze. Figure
5 shows the selected statements' average answers by sex. I chose statements
that either had similar averages for both sexes or different averages
by sex. It is possible that variance similarities between the sexes may
be determined by the average similarities. Perhaps statements where the
average of the two sexes were similar, the variance in answer that the
two sexes may have would also be similar. Or, perhaps when the averages
were different the similarities in variances may be more similar than
when the averages are similar. I explore this by choosing to analyze two
statements that had similar averages and three statements that had different
averages. Statements 3 and 19 were chosen because the averages for both
sexes were similar and statements 6, 19, and 28 were chosen because they
had different averages. Table 1 lists the questions I chose and why.

Figure 5: Average Answers by Sex to Select Statements
Table 1: Selected Statements for Variance Comparisons with Similar or Different Averages
|
Statement(s) |
Why chosen |
Why important |
|
Statement 3: "I have an idea I just don't know if they will be strong enough to provide a good paper " Statement 19: "I am happy with who I am" |
Similar averages: The average for females and males was very close. Averages for Statement 3: females 2.43, males 2.32, overall 2.39. Averages for Statement 19: females 1.43, males 1.42, overall 1.428 |
Because the averages for both sexes was close and this would allow a comparison of variances on a question where the average was similar. |
|
Statement 6: "before I break my foot off ion your @**" Statement 28: " don ' t cry " Statement 29: "My essay will be one how great of a student I am compared to the rest of my class" |
Different averages: One of the sexes had a higher average (more masculine) than the other. For statements 6 and 28 the average male answer is higher than the average female. For statement 6 the average was closer to 3 and for statement 28 the average closer to 2. For statement 29 the average for females was higher. Averages for Statement 6 females 2.76, males 2.95, overall 2.83 Averages for Statement 28 female 1.6, male 1.94, overall 1.73 Averages for Statement 29: female 2.1, male 1.68, overall 1.94 |
With the average different for the sexes this allows a comparison of variance with a different average. This could illustrate how variance may differ when averages differ. |
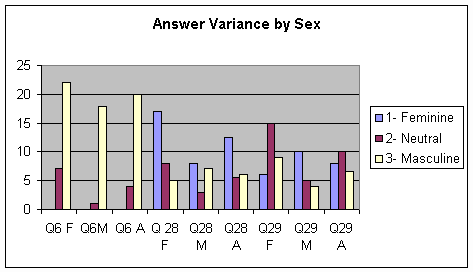
After determining which questions to study, I found the number of answers each gender had for these questions (Figures 6A and 6B). This illustrates the variance by displaying the number of times females or males rated a certain statement feminine, masculine, or neutral. It is interesting to see how some statements were almost completely rated as masculine and others showed the ratings were dispersed more evenly. For instance, most males rated statement 6 as masculine, only one did not. One the other hand, for statement 29 the answers were more diverse.

Figure 6A: Number of Answers by Sex with Overall Average for "Similar" Statements

Figure 6B: Number of Answers by Sex with Overall Average for "Different"
Statements
Charting the answers shows how the sexes did differ visually, but does not give numbers of the actual variance. So, I found the standard deviation of each statement by sex and then calculated the overall average standard deviation by sex. Table 3 shows the results and Figure 7 a visual representation of the results. The standard deviation shows there was some ratings variance by sex. For instance, on Question 6, the males' answers deviated much more greatly than the females'. However, the average of the deviations (listed in Table 3) shows there was an insignificant amount between the sexes for these five questions.

Figure 7: Standard Deviation of Sexed Responses
The similar deviation suggests that although for some statements the females and males may have had greater variance in ratings, overall the variance was similar for the two sexes. This is variance similarity is important because it suggests that the averaging I used in Questions 1 and 2 to analyze results is less problematic. Since both sexes had similar variance, the averages offer a clearer, more appropriate picture of the results. The similar variance suggests that the average represents each sex equally and whatever variance it might hide for one sex is similar to the hidden variance for the other sex.
Table 3: Standard Deviation for Sex by Question
|
|
female |
male |
|
Q3 |
0.568321 |
0.594089 |
|
Q6 |
0.435494 |
0.229416 |
|
Q19 |
0.568321 |
0.507257 |
|
Q28 |
0.770132 |
0.937595 |
|
Q29 |
0.711967 |
0.82007 |
|
average |
0.610847 |
0.617685 |
Procedure | Analysis and Results: Question 1, Question 2, Question 3, | Discussion
