Case 1: Bureau of Engraving and Printing Facility
Our first case focuses on the Bureau of Engraving and Printing's (BEP) efforts to build a new currency production facility. Part of the U.S. Department of the Treasury, BEP proposed building a new plant at the Beltsville Agricultural Research Center (BARC) in Beltsville, Maryland, to modernize equipment, improve efficiency, and enhance worker safety.
This proposal required a comprehensive environmental review under the National Environmental Policy Act (NEPA), which involves public input and an environmental impact statement (EIS) for any federal project that could significantly affect the environment. The public engagement process under NEPA involves two key phases. First, the scoping phase, which BEP initiated in late 2019, involves presenting the proposal and gathering public input on issues such as air quality, traffic, and environmental justice. BEP used various methods to engage stakeholders, including public presentations, fact sheets, and comment opportunities. Following the scoping phase, BEP published a draft EIS in late 2020. During the subsequent 45-day public review and comment period, stakeholders could submit comments through various channels, including email, the project website, and a public webinar. These comments were used to shape the final EIS, published in June 2021, with a 30-day public review period before the final decision in October 2021.
BEP's public engagement efforts during these two key phases—scoping and EIS preparation—is our focus in this case. In the sections that follow, we will provide a tour of the emerging digital tools used in the public engagement process.
Project Website
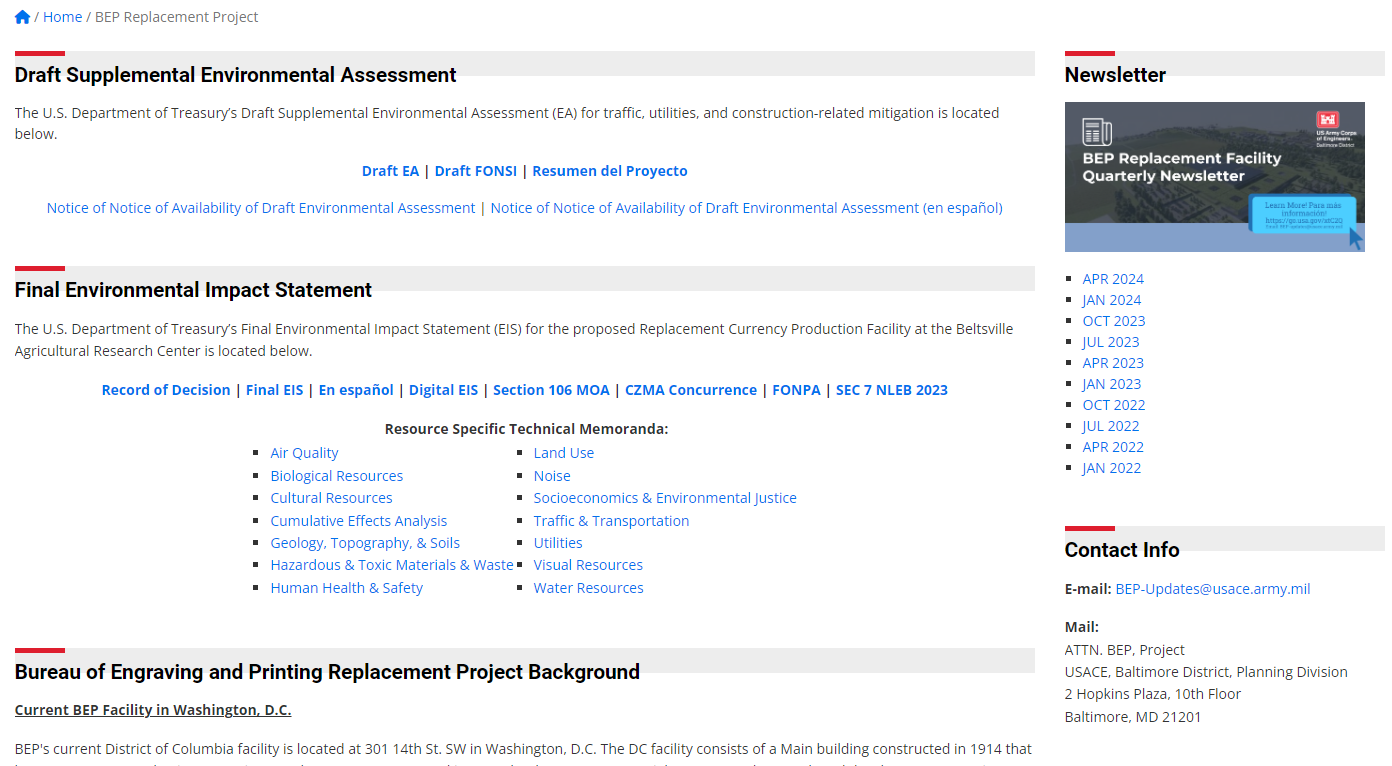
At the outset of BEP's NEPA process, a project website went live to provide an ongoing site of engagement. The project site is a single page with no navigation bar but has many subsections designed to provide additional context and links to supporting information. For example, there is a section on public scoping that includes links to the public scoping report and digital versions of the presentation slides, posters, and factsheets that were used during scoping. Information about the current phase of the project is featured prominently at the top along with links to the materials most relevant to that phase. For example, during the comment period on the draft EIS, links to the digital EIS and virtual reading room were prominently featured at the top of the landing page. In total, the project page currently features well over 100 links organized around six major sections, some of which feature collapsible subsections.
Virtual Reality Reading Room
Another digital tool that supported public engagement during EIS preparation was a VR-based "virtual reading room." Billed as a COVID accommodation, press releases and white papers promised that this VR-driven tool in combination with the GIS-driven tool we will discuss in the next section are the future of NEPA-mandated public participation: "These modern technologies reduce internal NEPA review times, increase meaningful public involvement, improve agency decision making, and focus on improved environmental outcomes, while achieving the proposed action's purpose and need" (AECOM, n.d.).
The virtual reading room is visually laid out to replicate the open-house-style poster session that it replaced. It's essentially a series of topical one-page summaries, with links to supporting materials and ways to submit a comment.
After clicking the link on the project website, participants are taken to the virtual reading room. The room has skylights, brick walls, and wooden floors. Virtual people of varying ages and races and wearing primarily professional attire are positioned throughout the room, looking at the ten large posters that ring the edge of the room. The posters are numbered sequentially, with the first "welcome" poster having a pulsing "start here" icon above it. Participants can click on the posters, which enlarges them and displays them as a one-page PDF on the screen. In the PDF view, participants can click to advance through all the posters. Participants can also exit the PDF view and rotate the virtual room to navigate to a specific poster.
In the center of the room is a table with three clickable objects sitting on it. On the right is a laptop that takes participants to the digital EIS. In the middle is a paper booklet that takes participants to the traditional draft EIS. On the left are three black filing boxes that link participants to various technical memoranda.
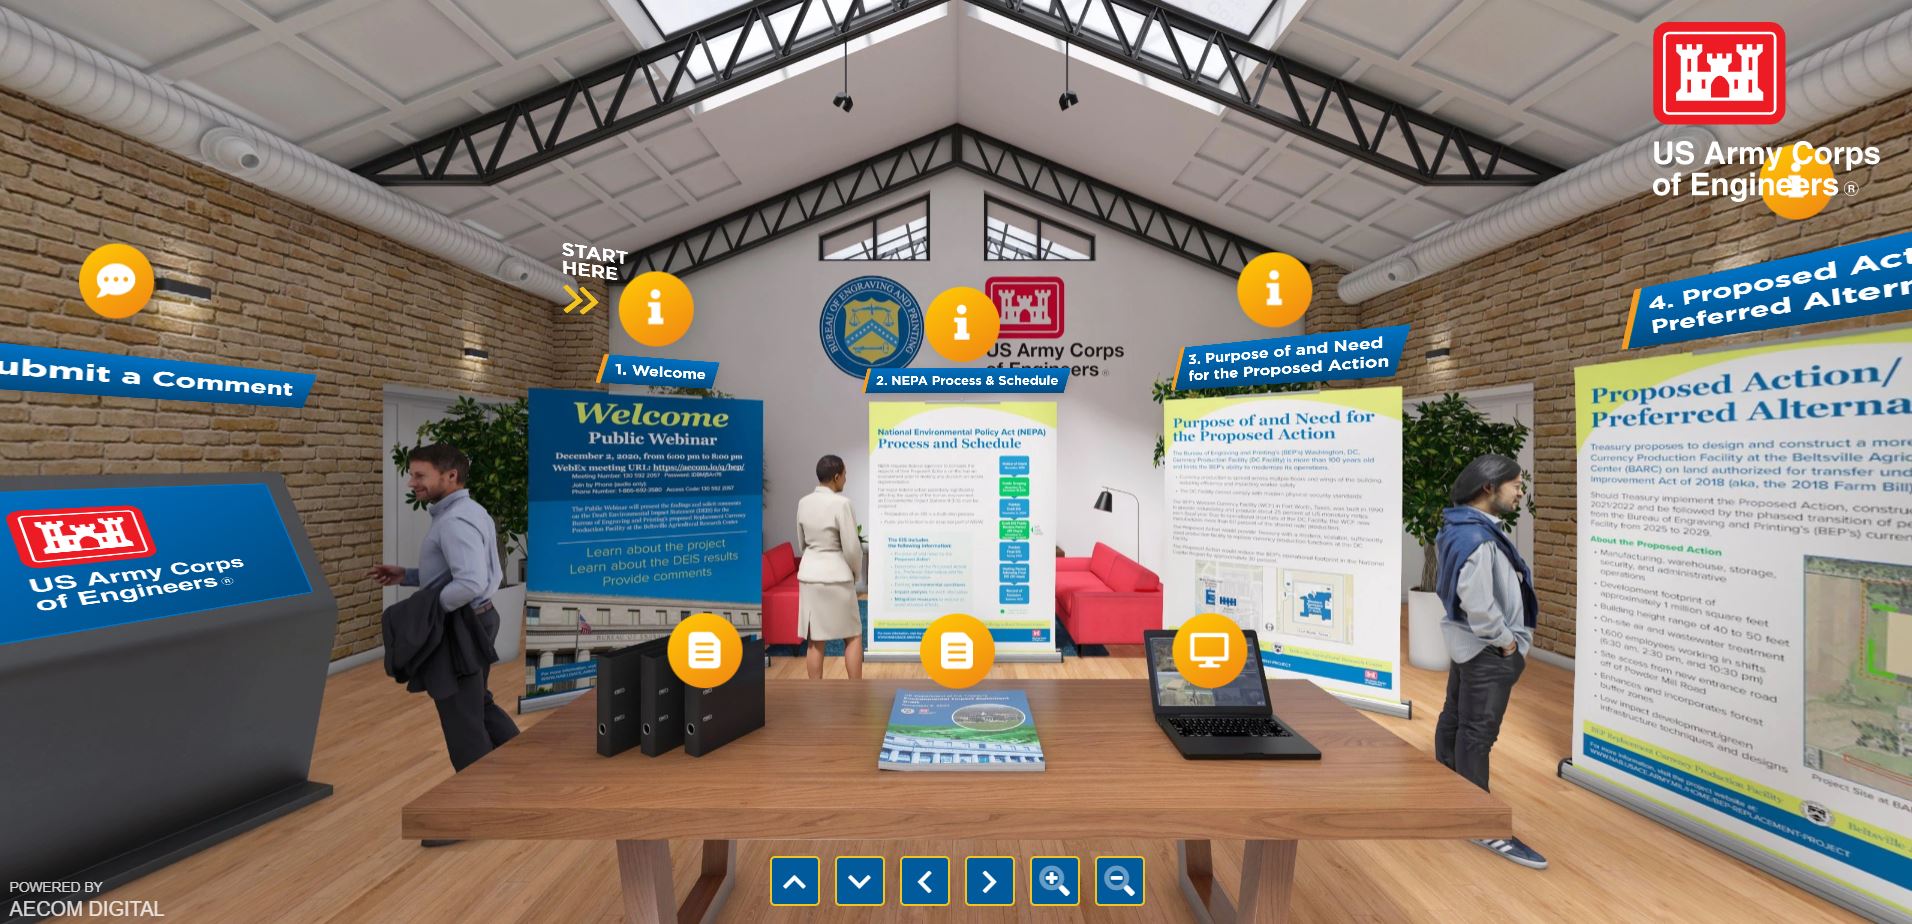
Between the first and last posters, there is an image of a large touch screen for collecting public comments. When participants click on it, they are presented with three options for providing feedback. Participants can click on the first button to email a comment. The second button allows participants to provide a comment through the project website. The third button downloads a comment form.
Digital EIS
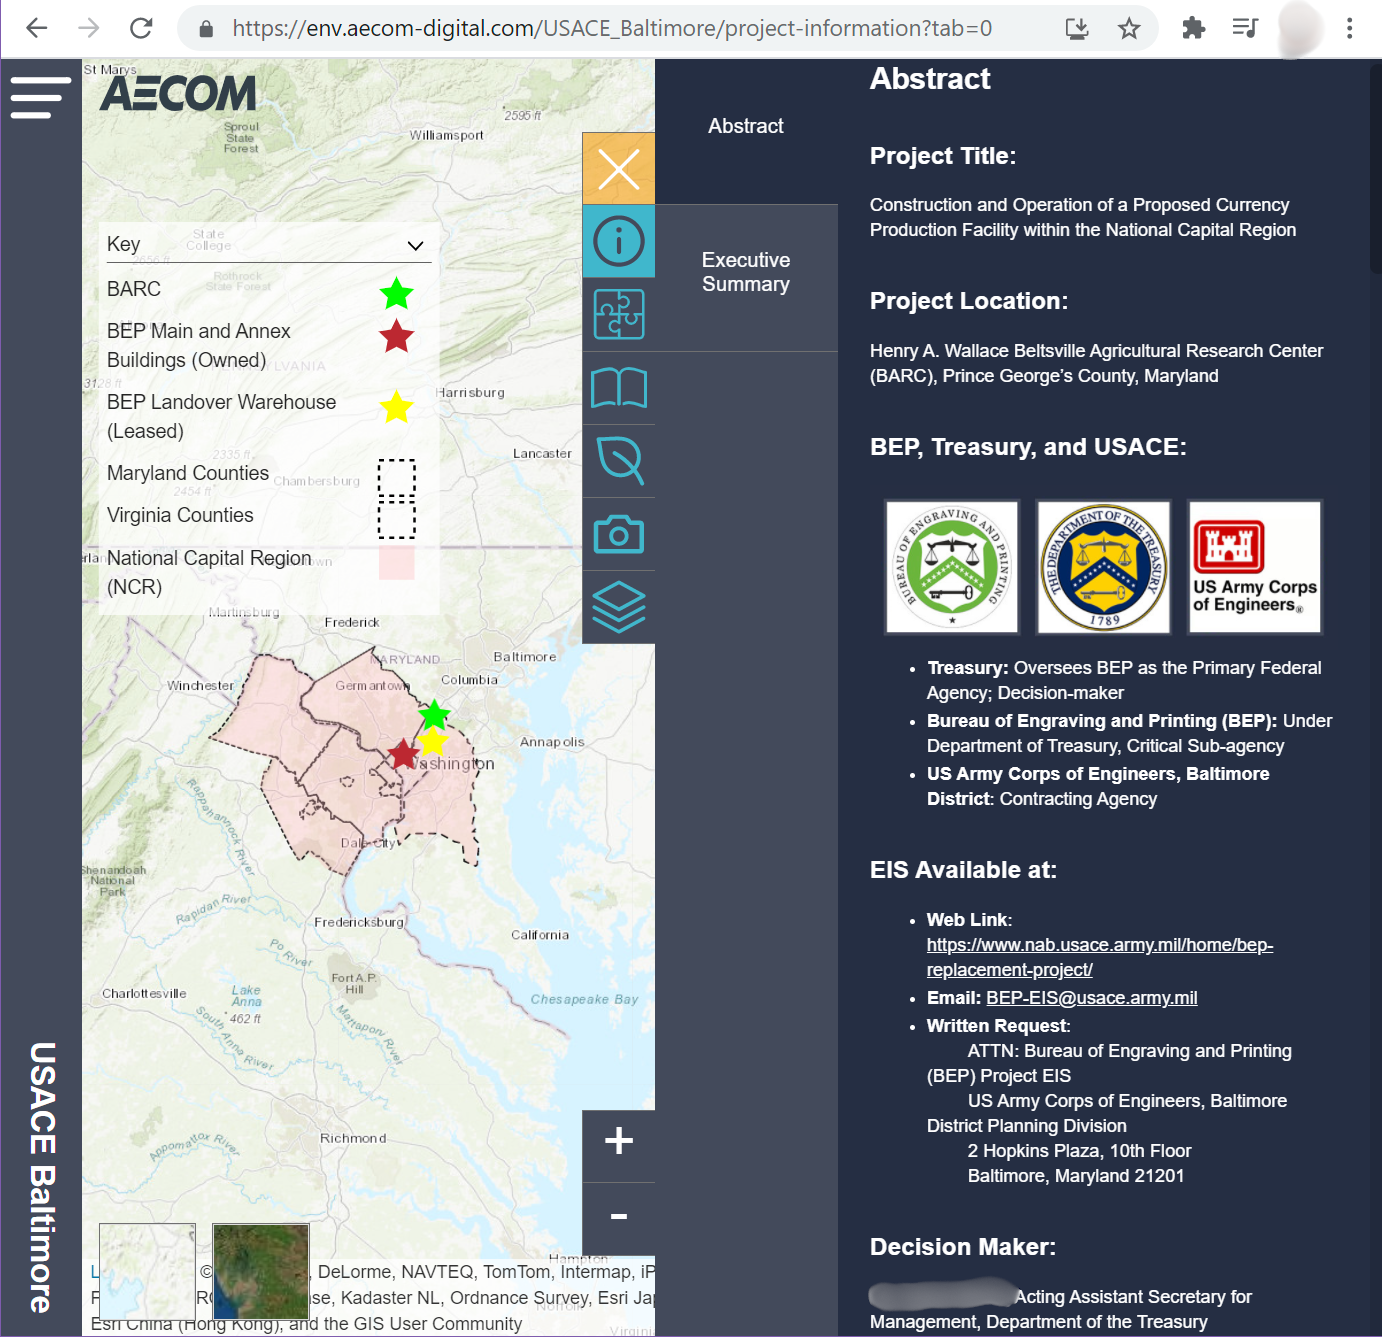
Another central digital tool that supported public engagement during EIS preparation was a GIS-driven "digital EIS." Developed in collaboration with the engineering consulting firm AECOM, the digital EIS provided "an interactive, web-based, fully navigable experience for stakeholders and decision makers to visually understand the proposed action" (AECOM, n.d.). This tool modularized the written EIS and technical memoranda, and supplemented them with interactive maps. It has a similar look to Esri's "story maps."
The landing page for the digital EIS provides high-level data on the right half of the screen and photos of the current and proposed sites on the left. Clicking the start button takes participants to the abstract. In general, the digital EIS is organized in the same way that a traditional EIS is (e.g., executive summary, purpose, need, proposed actions, alternatives, resource analyses). In the text on the right side of the screen, there are internal links that let participants drill down on specific topics and connect to the traditional EIS and other project documents. As participants scroll through the text on the right side of the screen, the visuals on the left side change. These visuals include photographs, GIS-maps, drone videos, and analytics.
Overall, we see BEP using these digital tools to primarily provide participants with voluminous information in a variety of formats by which they can build their own knowledge about the project. The tools also provide opportunities to collect public comments about the proposed action, alternatives, potential environmental impacts, and recommended mitigation measures. Ostensibly, this allows participants to share relevant information that will potentially shape the outcome, but it's unclear the extent to which that happens in practice.
In other words, this case illustrates how science or technical communication in public engagement contexts requires more than just making scientific information available and approachable. The digital tools employed demonstrate the technical communication challenges of designing spaces that not only present complex environmental impact data, but also support meaningful stakeholder participation in the decision-making process. While the virtual reading room and digital EIS promise to "revolutionize public engagement," their effectiveness as spaces for dialogue and deliberation—key aspects of both science2 and democratic engagement—remains limited.