Conclusion
The PPSM and CMM findings I present in this article provide only a small example of the Mapping Digital Technology in Rhetoric and Composition History project's potential as a disciplinary research resource. This study's conclusions are certainly contestable, and perhaps unremarkable, but they are crucial validations of the project's quantitative, visual methodology. These findings demonstrate that the Mapping Digital Technology in Rhetoric and Composition History project is a generative tool to produce historical narratives rather than merely a graphical means to illustrate them.
There are several ways to use and augment the current study. Visible patterns in the current PPSM and CMM such as the overt areas of high and low activity density are not addressed in this webtext. Also, the data pool currently only includes ten representative online rhetoric and composition journals and the sample period ends in 2008. Bringing the data for current publications up to date and adding additional publications would enrich the pool, allowing coherent new patterns to emerge. It is also possible to juxtapose the PPSM and CMM, despite their formal differences. Although such an examination is beyond the scope of this webtext, preliminary research suggests visible connections can be made between institutional predominance in the PPSM and term dissemination in the CMM. These and other research avenues are possible using the currently available study resources and may be of interest to other scholars in our field.
Regarding the Mapping Digital Technology in Rhetoric and Composition History project as a whole, there is an almost limitless number of additional data sets that it could accomodate such as the locations of conferences, graduate programs, book publications, and grant winners. Because data appear as map layers, each addition is exponentially productive; it reveals information about its own subject and may be compared to other mapped data sets to identify relationships.
Additionally, the project framework could be used for in-house interests such as tracking graduate program graduates, akin to the print example from Purdue University shown below in Figure 1.
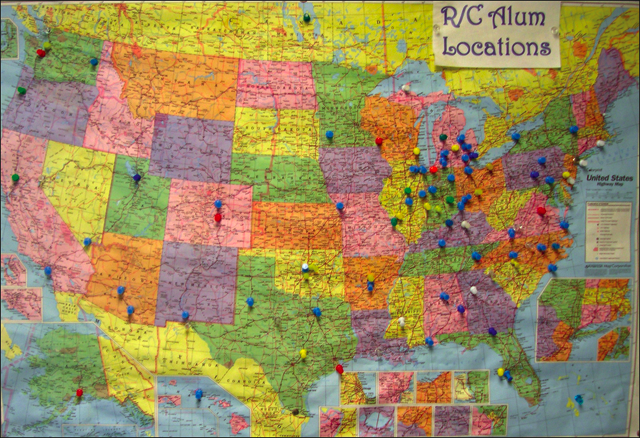 Figure 1. The Purdue University Rhetoric and Composition Alumni Map uses push pins to track the location of program graduates.
The Mapping Digital Technology in Rhetoric and Composition History platform can grant such local projects broader access and greater collaborative capabilities. Such maps make excellent visual arguments for the importance and broad effect of specific programs, departments, and institutions.
The project framework can also become more valuable by increasing its depth, thereby providing more information about individual contributions at institutions. An effective way to acheieve this depth would be to expand the project's current pop-up template. For example, pop-ups in the PPSM could contain not only the institution’s name, location, and the corresponding journal and year but also a more comprehensive breakdown of authors, work titles, editors, and sponsoring locations. Figure 2 provides a mock-up of such a data-rich pop-up.
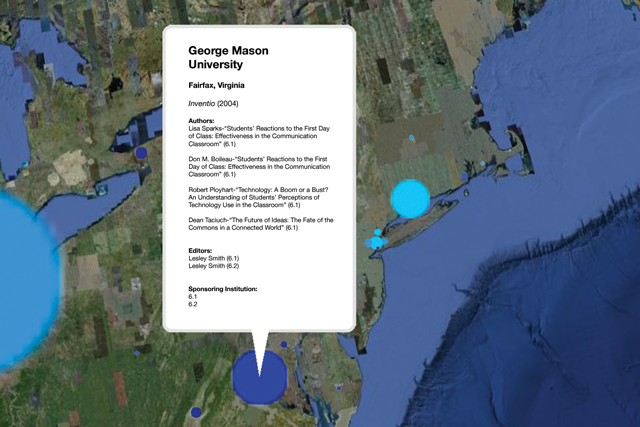 Figure 2. Mock-up of enhanced PPSM pop-up balloon containing additional per-issue data about individual contributions, including author and editor names, work titles, and locations of online journal sponsoring institutions.
A similar augmentation is possible for CMM pop-ups, which could identify the sources of terms in corresponding article/review titles and journal issue themes, as shown in Figure 3 below.
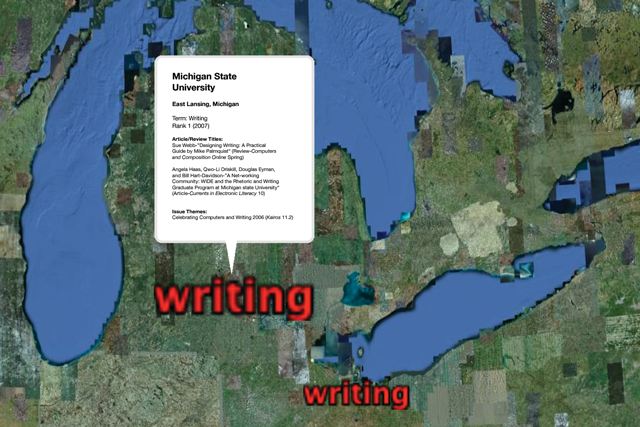 Figure 3. Mock-up of enhanced CMM pop-up balloon containing additional per-issue data about individual contributions, including author names, work titles, and journal issue themes.
These modifications would increase the maps' utility by providing additional data aspects without complicating their interfaces.
Additionally, this article's discussion of methodology may be useful for projects other than Mapping Digital Technology in Rhetoric and Composition History. Particular issues likely will recur when using a visual, geographical method to produce histories; this work may provide some guidance about how to negotiate them, if in no other way than providing one workable example.1
Having reiterated the potential value of this work, I invite colleagues to use (and perhaps supplement) the Mapping Digital Technology in Rhetoric and Composition History project or to use this pilot study as an example of one way to explore and present the geographical aspects of our shared discipline. Geographical visualization is a potent means to examine our field's rich history, and appropriate tools and methods are freely available and within our ken as rhetoricians and compositionists. As this special issue demonstrates, a significant new mode of field research is now possible for motivated scholars.
1 See Tirrell (2009b) for greater detail about issues surrounding the technical and rhetorical challenges encountered during the Mapping Digital Technology in Rhetoric and Composition History project's production.