If we acknowledge that literacy and learning have always been multimodal… the challenge becomes one of finding ways to attend more fully—in our scholarship, research, as well as our teaching—to the material, multimodal aspects of all communicative practice. (Shipka, 2011, p. 21)
HEADQUARTERS
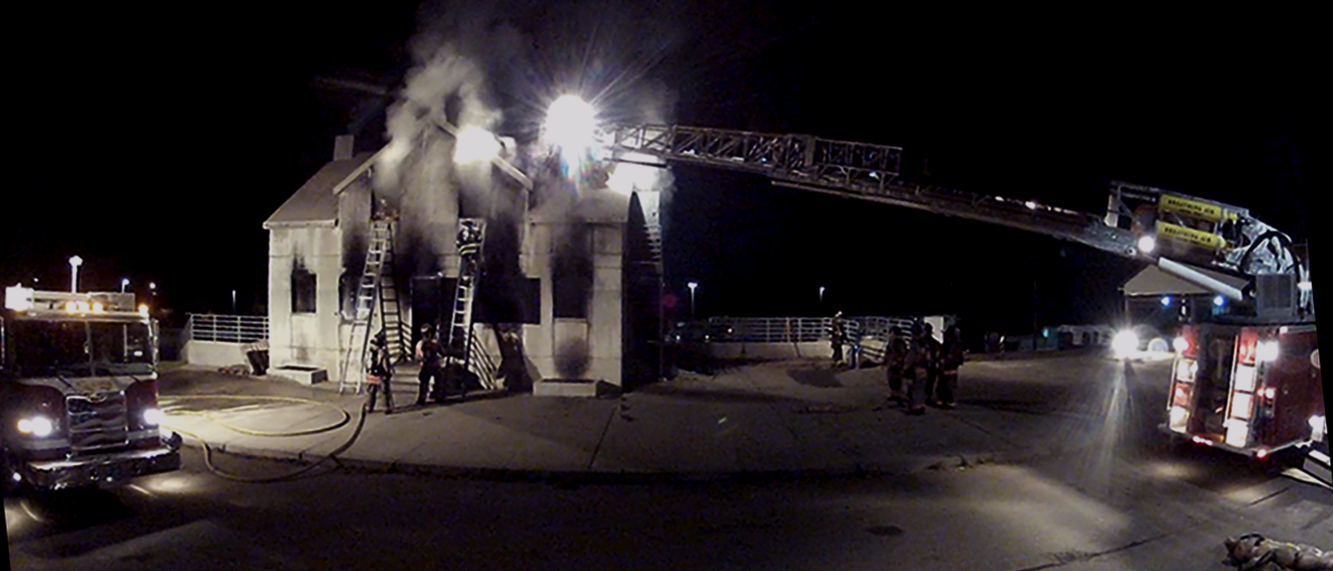
In this webtext, I present a set of interactive visualizations that illuminate firefighters' richly layered, multimodal literacy practices. These mission-critical literacies scaffold the work these first responders perform within risk-laden environments—such as providing emergency medical care on a highway, suppressing a fire within a commercial building, or conducting a high-angle rope rescue on the side of a mountain—as they enable firefighters to communicate, gather information, identify hazards, develop plans, assess risks, and coordinate activities. Alongside the data-anchored visualizations, this webtext explores two interrelated questions:
- What might scholars and practitioners stand to learn from a data visualization project that has sought to render firefighters' literacy practices visible?
- How might data visualizations (artifacts) or visualizing data (processes) be leveraged to shed light upon the tacit and mundane, yet highly consequential, role that literacies play within situated workplace activities?
In pointing toward a reflexive tension between research design and data visualization, I aim to demonstrate how decisions regarding research design and data visualization could be utilized to reinforce or disrupt dominant representations about what and how literacy mean with and for work. With respect to firefighters, these visualizations seek to push back against reductive representations of blue-collar work that circulate within cultural narratives, images, reports, and even databases. In particular, I seek to push back against the "cultural iconography," as Mike Rose (2009) has described it, surrounding blue-collar work that "promotes the muscled arm, sleeve rolled tight against biceps, but no brightness behind the eye, no image that links hand and brain."
In this webtext developed for the Inventio section of this journal, audiences will find that the discussion here primarily surrounds the iterative process of designing and refining a methodology that was not only sensitive to firefighters' literacy practice, but also appropriate for analyzing a data set that consists of hundreds of still images, hours of video and audio recordings, and hundreds of pages of interview transcripts. More specifically, this webtext outlines how decisions about data collection, segmenting, organizing, coding, structuring, styling, and modeling data influenced, in turn, which elements of literate practice were emphasized within the visualizations. Ultimately, my hope is that this webtext offers members of writing studies, computers and composition, professional and technical communication, and/or the fire service tools, methods, and practices to adapt in order to explore literate practice within other contexts.
Including HEADQUARTERS, the webtext is organized into six sections. In SIZE UP, I sketch the exigency that motivated this project and point toward scholarship that influenced my approach. In DATA OPS, I discuss the steps associated with gathering examples of firefighters' multimodal literacy practices, including the steps associated with segmenting and qualitatively coding the data set. In DESIGN OPS, I talk through choices I made to structure, style, and visualize data. It is in this section that readers will find two interactive data visualizations. "Figure 18: Chief Burke: Structure Fire" presents a view of the richly layered, multimodal practices that a high-ranking fire officer used to manage a fire scene, and "Figure 19: Orderville Fire Department: Structure Fire" offers a view of the richly layered, multimodal literacy practices that were visible as members of a Special Hazards company coordinated search and rescue activities during a live-fire evolution. In DEBRIEF, I provide a set of screen recordings where I actively demonstrate the types of analytical inferences researchers might draw using these data visualizations and reflect on some of the key lessons that I've learned about methodology and design from this project. Finally, REFERENCES cites and recognizes scholarship that has supported this project.